Form Abandonment Analytics: Why Users Quit & How to Fix It
Pinpoint high-friction fields and streamline your lead flow. Detect drop-offs, diagnose errors, and ship faster, higher-converting forms.
By Mandeep Singh ·
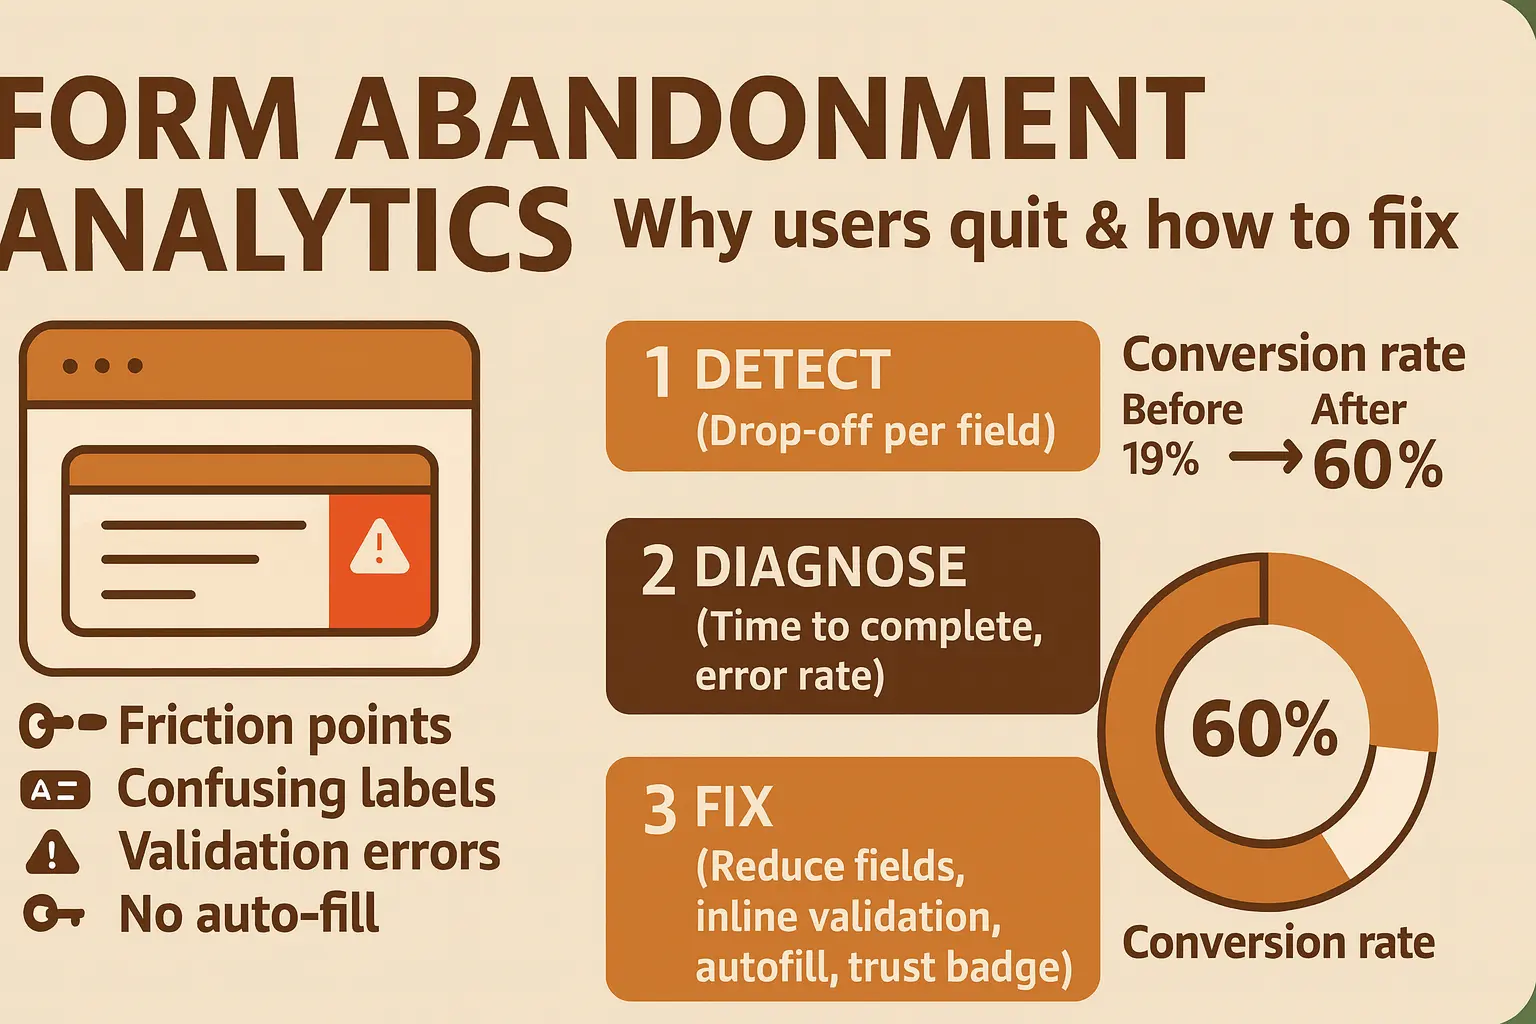
Do this: reduce fields, add inline validation & examples, enable autofill/masks, and show trust/benefit near the submit button.
What Is Form Abandonment Analytics?
It’s the practice of tracking every step—view → start → field interactions → submit—to see where users quit and why. Modern form-analytics tools surface drop-off per field, time to complete, and error rate so you can prioritize fixes that unlock conversions.
- Friction points: too many required fields; unclear labels/placeholders.
- Validation problems: late errors, strict formats, hidden requirements.
- Missing helpers: no autofill, no input masks, no real-time hints.
Why Users Quit—and Why It Hurts
Abandonment quietly drains pipeline and ad spend:
- Leaky funnel: high-intent visits fail at the last step.
- Wasted traffic cost: paid clicks don’t convert without a smooth form.
- Trust gap: asking for too much without context increases drop-off.
Reading Your Form Analytics
Use these modules together to spot impact quickly:
- Field Drop-off Report — shows the exact field where most users quit. Prioritize the highest-loss rows first.
- Error Rate & Time to Complete — flags fields that trigger repeated errors or slow users down (e.g., phone, date, company size). Add masks, examples, or relax validation.
- Form Outcome Timeline — overlays submits, errors, and hesitations to confirm which changes improved completion.
Pro tip: pair analytics with heatmaps/session replay to watch hesitation right before the worst field.
1-Hour Form Optimization Plan
- Open Field Drop-off → export top 5 losing fields.
- Watch 3–5 replays where users hesitate/quit on each field.
- Ship fixes: remove/optionalize fields, add hints + masks + inline validation.
- Place privacy/trust copy by the submit; shorten CTAs (“Get quote”, “Book demo”).
- Re-scan metrics in 24–72 hours and keep the changes that lift completion.
What to Track (Beyond “Starts”)
- Form completion rate (views → submits).
- Field-level drop-off (top 3 problem fields).
- Error rate per field + time to complete.
- TTFA (time to first action) and hesitation time before submit.
FAQs
How many fields is “too many”?
Only what’s essential for the first conversion. Move nice-to-have questions to a follow-up step/email.
What’s the fastest win?
Enable browser autofill plus inline, real-time validation; make optional fields truly optional.
Do progress bars help?
Yes—especially for multi-step forms. Show steps and allow saving progress.
When should errors appear?
Immediately after the field loses focus (or while typing when safe). Include a clear example format.
Make Your Forms Effortless
Great forms feel invisible. The right analytics reveal where users struggle—field drop-off, error rate, and completion time—so you can trim friction and lift conversions.